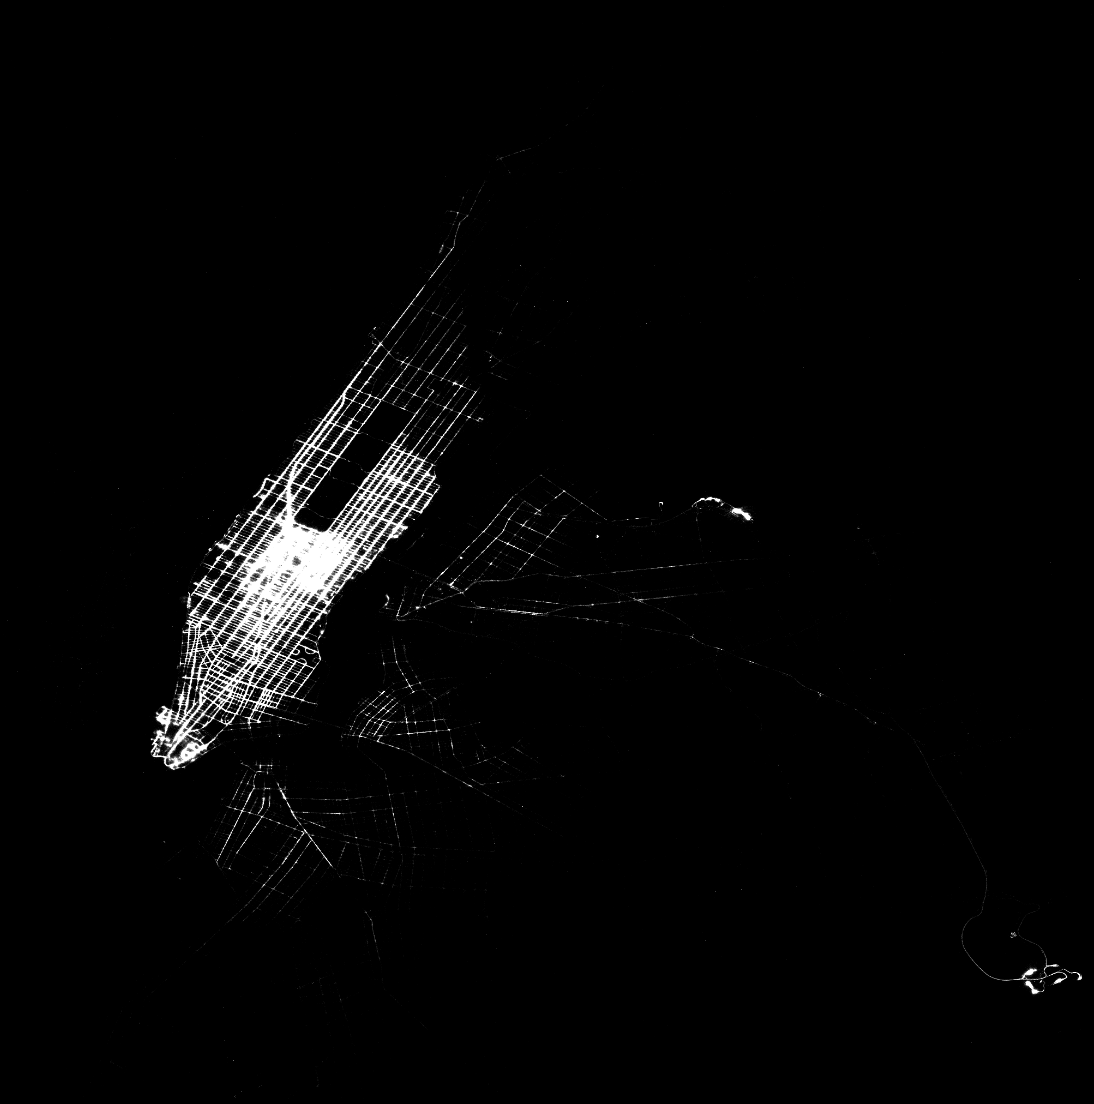
Here we are taking a look at the famous (at least amongst data analysists) NYC Taxi and Limousine Commission Trip Records. I will be using a subset of the total data corpus detailing 72,368,450 individual cab rides taken between January 2015 and June 2015 inclusive, and totaling ~28Gb of raw data.
To get a handle on the data the GPS coordinates for each pickup and drop-off location were binned into neighborhoods as defined by the New York City Department of City Planning Neighborhood Tabulations 2010 census tracts. All the analysis was preformed using PostgreSQL / PostGIS (for the heavy geospatial stuff), Python / Pandas (for any additional processing), and D3.js to generate the images; analysis scripts can be found on my github. That out of the way and without further ado, lets take a look at the data!
First let’s take a look at taxi cab passenger flux into/out of New York city neighborhoods during an average weekday. (Here I am grouping all weekday trips by pickup neighborhood (efflux) or drop off neighborhood (influx) and hour, and then aggregating the groups by summing the total number of passengers. The net flux is simply the difference between the number of passengers that arrive in a neighborhood during the hour, and then number that departs.)
You will notice during the animation that between 6:00 A.M. and 12:00 P.M. neighborhoods like Midtown Hudson Yards, SOHO and Lower Manhattan all experience a large net influx of traffic (Blue) that drops off into the early afternoon. This trend then reverses itself around 7:00PM as the net cab traffic begins to stream out of these areas (Red) and the work day draws to a close.
Also noteworthy are the airports; JFK and LGA. Cabs begin taking more travelers to the airport during the early A.M. (beginning around 5:00 A.M.) and by the early afternoon ~11:00 A.M. are picking up more passengers from the airports.
This style of visualization helps us to understand where passengers go during the work day, but where are they are coming from?
I next looked at the most frequent taxi trips in terms of departure and destination neighborhoods, and made a chord diagram representing where passengers travel between 20 neighborhoods with the most taxi traffic.
It is immediately clear that Midtown Manhattan is the central tranisit hub for taxi traffic in the city.
Also interesting is that the cab riding population of the 'North Side' neighborhood, more commonly known as Williamsburg Brooklyn (home of beards, blue ribbon beer, trucker hats and all things meta/ironic), seldom take cabs into Manhattan. Most cab fares (~60%) that begin in Williamsburg end in Williamsburg.